
Visualization & reporting
Data Visualization
Describing the nuance in making data accessible.
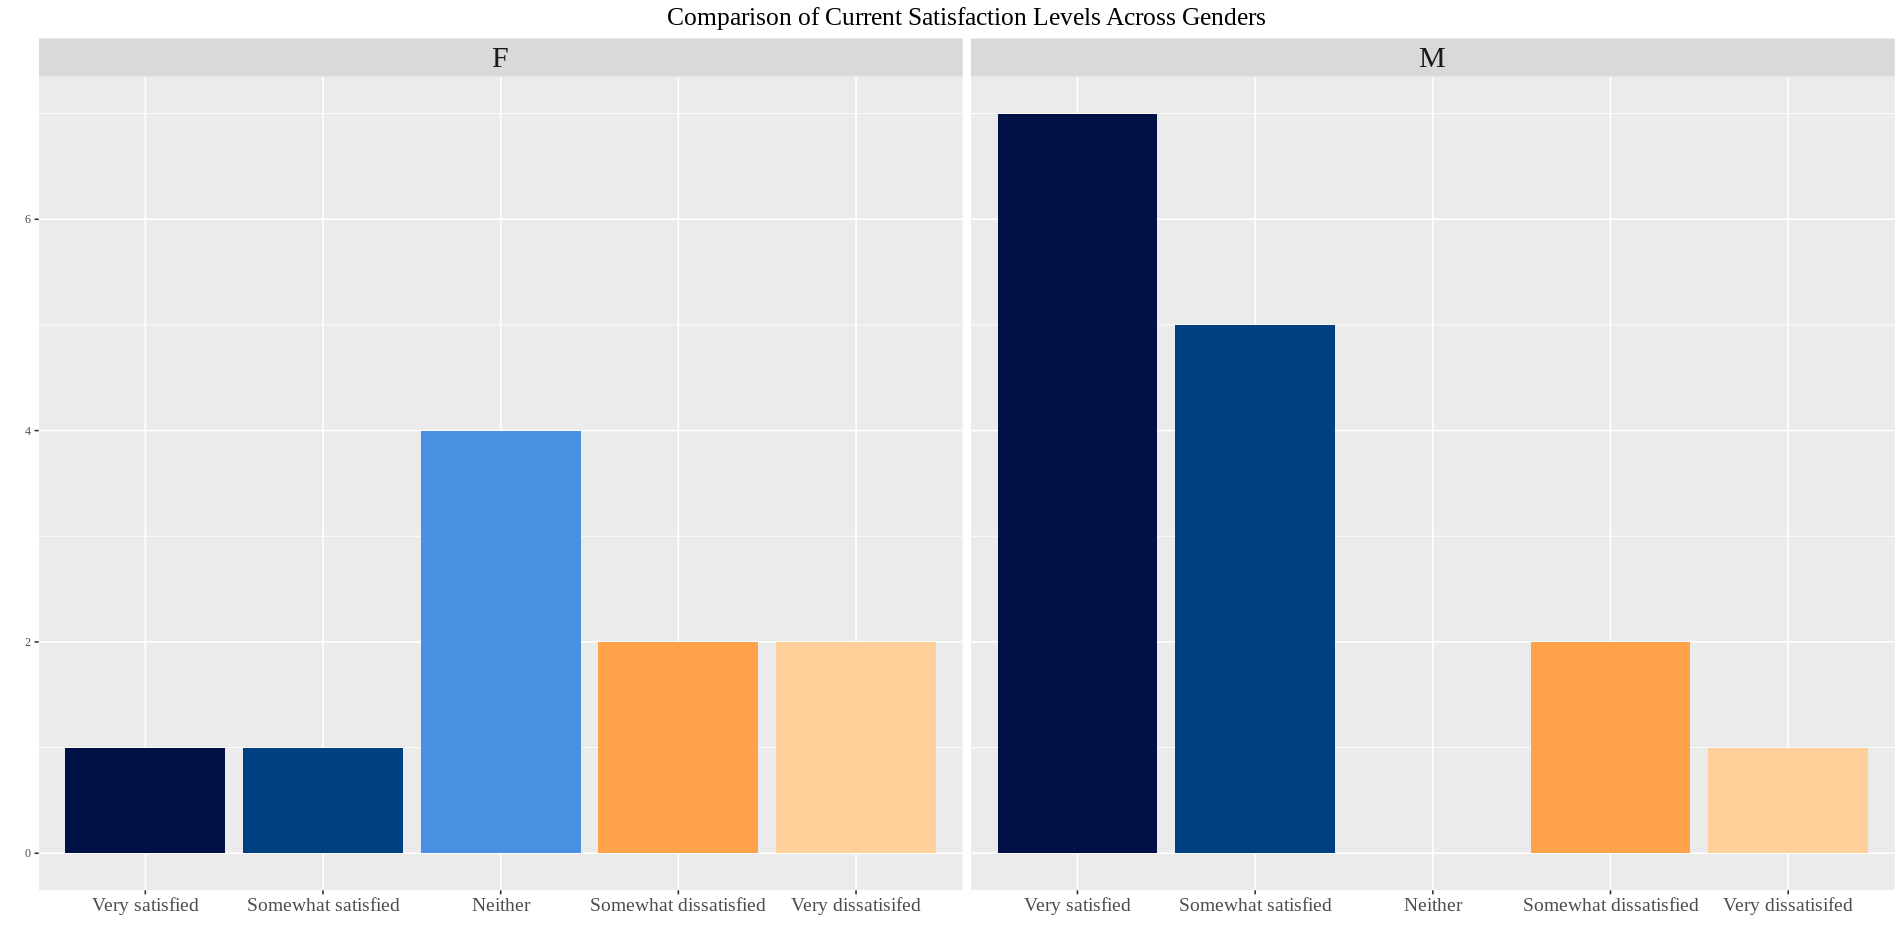
We interact with many forms of data visualization in our daily lives, often without even realizing it. From weather maps to public transportation guides, data visualization plays a critical role in clearly explaining ideas to people of different backgrounds. Visualizing data in an effective and inclusive manner is the premise of the project undertaken by my teammate, Karla Cruz Sanchez ‘26, and myself wherein we constructed graphs for Dr. Annette Nierobisz’s (from Carleton’s Sociology Department!) research article on the long term impacts of late-career job loss.
This project provided me with invaluable experience in data visualization and analysis, and it allowed me to refine my R skills and explore new tools like GitHub for collaborative coding. Furthermore, I learned about late-career job loss and its critical socioeconomic effects such as. Apart from being the first formal task that I got to tackle as a new Data Squad member, I also came to understand the importance of inclusivity in the graph colors we choose. This is an area where I have a lot to improve, as achieving a good balance between hue, saturation and value for a visually appealing color palette accessible to those with color-blindness was one of the most challenging aspects for me in this project.
Furthermore, I learned that it is not a good approach to represent attributes solely through color and that alternative approaches such as using clear labeling or other visual cues like icons or symbols are better to use. However, I found various tools such as the Coblis simulator (an online tool that simulates what different images look like for those with color vision differences) helpful in making sure my color choices were inclusive.
- Partner
- Sociology and Anthropology Department
- Client
- Annette Nierobisz
- Team
- Rachel Kim, Karla Cruz Sanchez
- Source
- Originally published ↗