
Analysis & modeling · Visualization & reporting
Visualizing the MISO survey of technology services
Small-multiple charts of more than 30 question pairs on how faculty, staff and students rate the college's technology services, with a cleaner way to link services to departments.
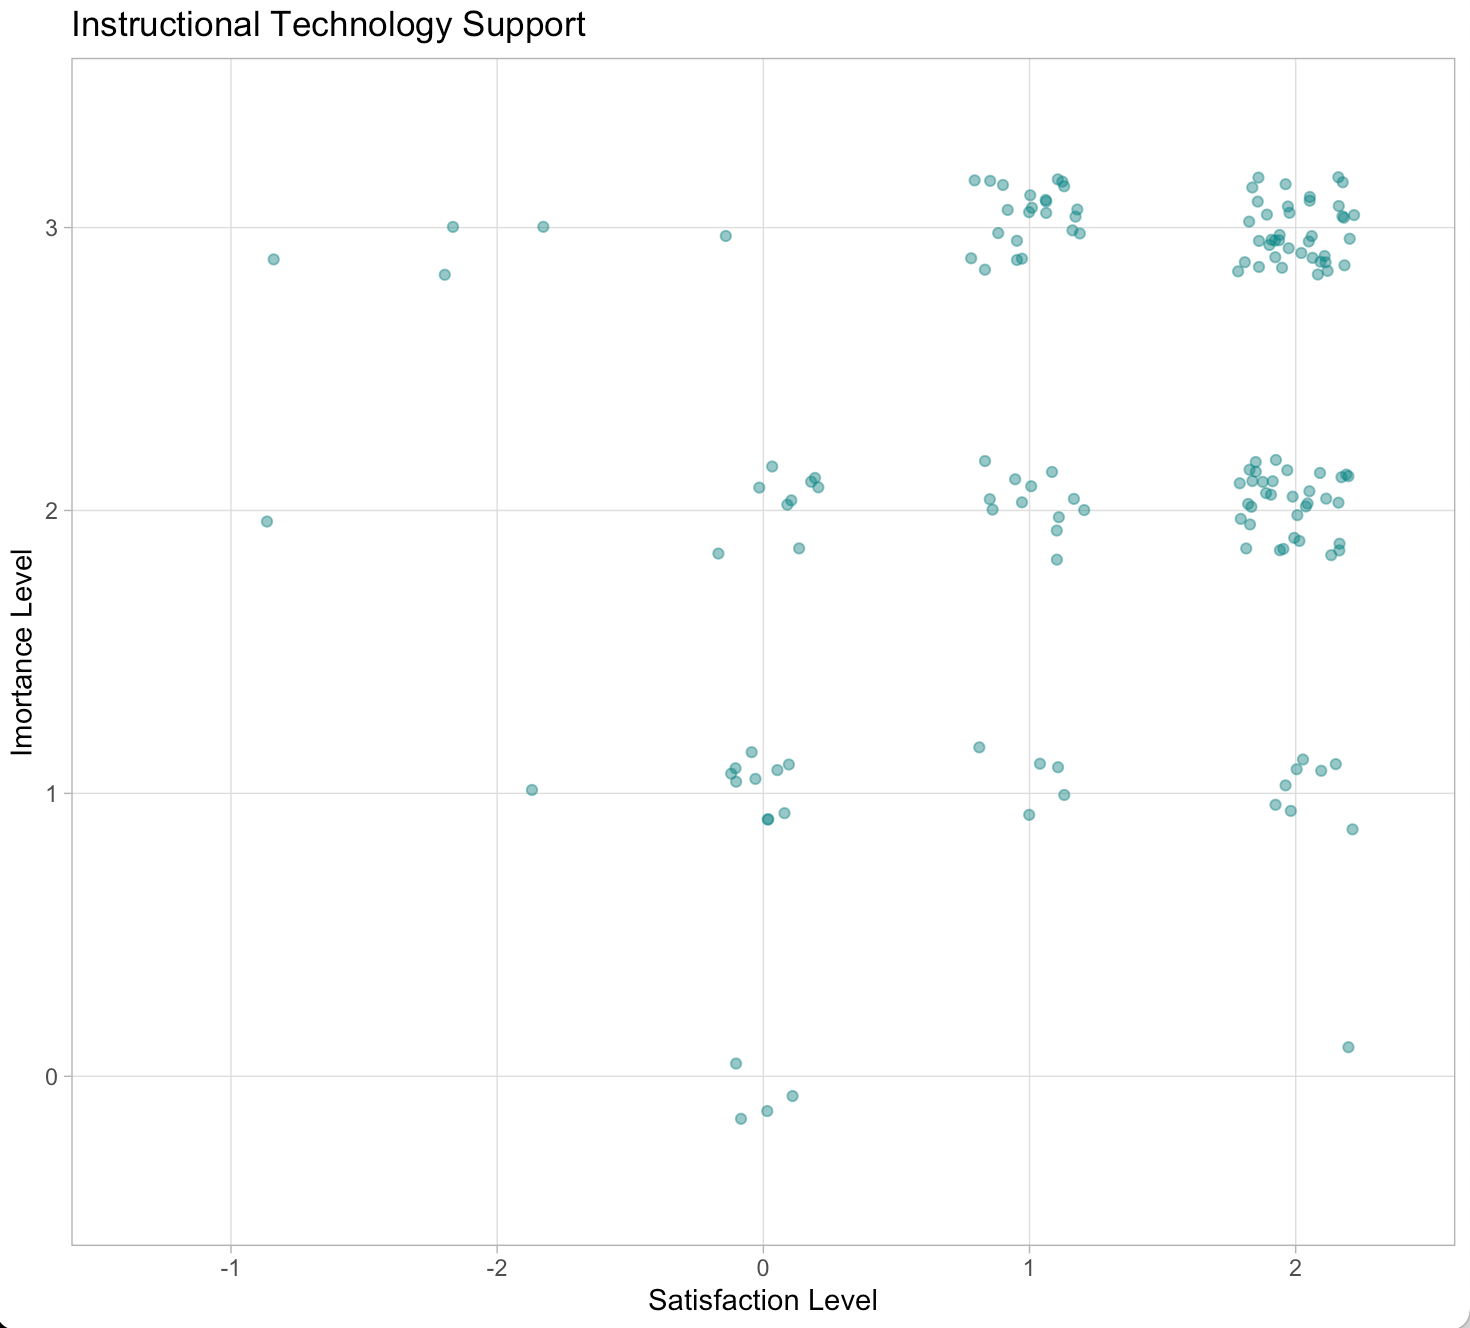
The Measuring Information Service Outcomes (MISO) survey asks faculty, staff and students how satisfied they are with the college’s technology services. Using Edward Tufte’s approach of small multiples, the DataSquad designed an efficient visualization of more than 30 question pairs about those ratings.
Nobuaki Masaki took the project over from another DataSquad member, so he started by reviewing the documentation in the unfinished R code that cleaned the data. One part assigned each of more than 20 services to a department (ITS, the Library, and others) with two hand-written lists matched by position. That is easy to follow but leaves room for human error, makes it hard to confirm every service was counted, and, because the lists would need redefining for each new survey, hides where the relationship lives in the project.
His version loads a separate relationship file that matches services to departments and joins it to the data. The code is slightly harder to read, but the file can be found and edited for later surveys, and it makes it easier to check that every service is accounted for.
- Years
- 2019
- Partner
- ITS
- Team
- Nobuaki Masaki
- Tools
-
- R
- Source
- Originally published ↗